Intro
I use ZFS at home in my homelab for basically all of my storage... Docker uses
ZFS backend, all my VMs have their .qcow2 images in their own zfs datasets,
and all my shares are ZFS datasets. I love ZFS but my home hardware presently
is the opposite of expensive or new... Thankfully I've had a lot of my orginal
homelab simply given to me but the cost of this is that I didn't put my
machines together, I didn't choose the disks, and I definitely didn't do the
research I would've otherwise done had I bankrolled my server personally...
The Problem
I run glances on basically all my machines and for the longest time I have
been seeing big time iowait issues. Now, since everything was free I've
largely been able to ignore that however I'm now after some better performance
which I think means new hardware!
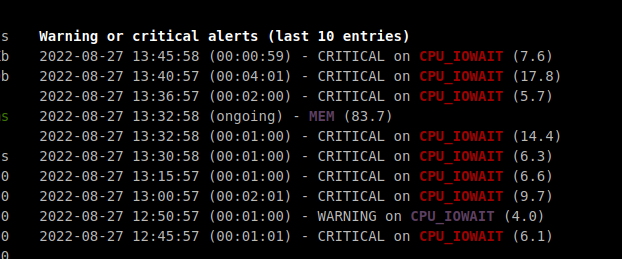
Here is a random screenshot of my glances homepage at time of writing - The
only major load on my server is some ffmpeg transcoding (about 60% CPU
utilization)...

As you can see... there's a lot of issues and I don't even know what they mean.
fio
I heard about fio through a friend and
decided to try it out quick. It installs with apt on ubuntu quick and easy...
Jim Saltar has a good blog post on it here
Basically it's a handy tool for benchmarking your disks and the blog dives into what types of metrics matter - it's not just throughput, but also latency, iops, etc.
Tests
I ran a few basic commands inside a new zfs dataset on my server tank/fio
fio --name=random-write --ioengine=posixaio --rw=randwrite --bs=4k --size=4g --numjobs=1 --runtime=60 --time_based --end_fsync=1 > single-4KiB-random-write.txt fio --name=random-write --ioengine=posixaio --rw=randwrite --bs=64k --size=256m --numjobs=16 --iodepth=16 --runtime=60 --time_based --end_fsync=1 > 16-parallel-64KiB-random-write.txt fio --name=random-write --ioengine=posixaio --rw=randwrite --bs=1m --size=16g --numjobs=1 --iodepth=1 --runtime=60 --time_based --end_fsync=1 > single-1MiB-random-write.txt
Results
The single 4 KiB random write:
WRITE: bw=7836KiB/s (8024kB/s), 7836KiB/s-7836KiB/s (8024kB/s-8024kB/s), io=523MiB (548MB), run=68317-68317msec
The 16 parallel 64KiB random writes:
WRITE: bw=93.9MiB/s (98.4MB/s), 5599KiB/s-6303KiB/s (5734kB/s-6454kB/s), io=7642MiB (8013MB), run=81310-81418msec
The single 1MiB random write:
WRITE: bw=81.2MiB/s (85.1MB/s), 81.2MiB/s-81.2MiB/s (85.1MB/s-85.1MB/s), io=8177MiB (8574MB), run=100699-100699msec
Summary
So I don't fully understand these numbers yet... 80-100 MiB/s isn't super fast and that's across a parallelized workload... The single threaded workloads have awful performance so this tells me something is wrong... I have a few ideas...
- ZFS dataset config options such as
ashiftor the blocksize might be way misconfigured - The disks/pool which came from a TrueNAS/FreeBSD machine may have some artifacts that I need to clean up
- The SAS controller I am using, which I flashed with IT firmware to get it into JBOD mode might be messed up
- The data cables themselves could be a problem...
Points 3 and 4 are less likely given that the write speed does increase in the parallelized job but I'm a newbie so it's time to dive in!