Streamlit
I use streamlit for any EDA I ever have to do at work.
It's super easy to spin up a small dashboard to filter and view dataframes in, live, without the fallbacks of Jupyter notebooks (kernels dying, memory bloat, a billion "Untitled N.ipynb" files, etc.)
At the highest level, streamlit lets you write a python script and call streamlit run my_script.py which will open up a web server with your streamlit stuff.
The dashboard refreshes whenever you change the script so you can add capabilities in real time, super fast!
I'll show an example of using streamlit and plotly to make a live dashboard to monitor system memory usage with psutil.
This is apart of my posts on psutil and deques...
example at the bottom!
Plotly
I'm not going to make a big time intro to plotly here - there's a billion resources on the interwebs and the docs are really good.
Suffice it to say it's my goto plotting library for basically any and all needs. I'm currently exploring it for live data streaming as I'm not sure it's the best solution but it's the one I'm familiar with.
For my not-netdata project of visualizing live system resource data I first need a way of appending data and popping data in and out of an array at every data refresh cycle to keep my plots looking nice with a fixed time window.
See deques for a short intro to the datatype I'm using.
First step is to initialize some objects to store data in.
data: Dict[str, MutableSequence[Optional[float]]] = defaultdict(deque) arr_size = 10 data["time"] = deque([None] * arr_size) data["used_memory"] = deque([None] * arr_size)
data is a dictionary that I'll store deques in. The dictionary keys will be the type of data, in this case time and used_memory.
I fix an array size, arr_size to just 10 for now
Then I initialize the values for time and used_memory as deques of length arr_size.
Simple enough!
Next is to fill those deques with some relevant data. I'm not actually sure if this is the best way to do this but here's what I have done so far:
def refresh_data(): global data memory = psutil.virtual_memory() data["time"].append(time.strftime("%Y-%m-%d %H:%M:%S", time.localtime())) data["used_memory"].append(memory.used // (1024**3)) data["time"].popleft() data["used_memory"].popleft()
If you ignore my usage of global you'll see that I can just append to each deque like it was a list.
But then to keep the relevant data in the deque, and to keep the length fixed, I simply popleft to remove the oldest datapoint!
A trivial dashboard
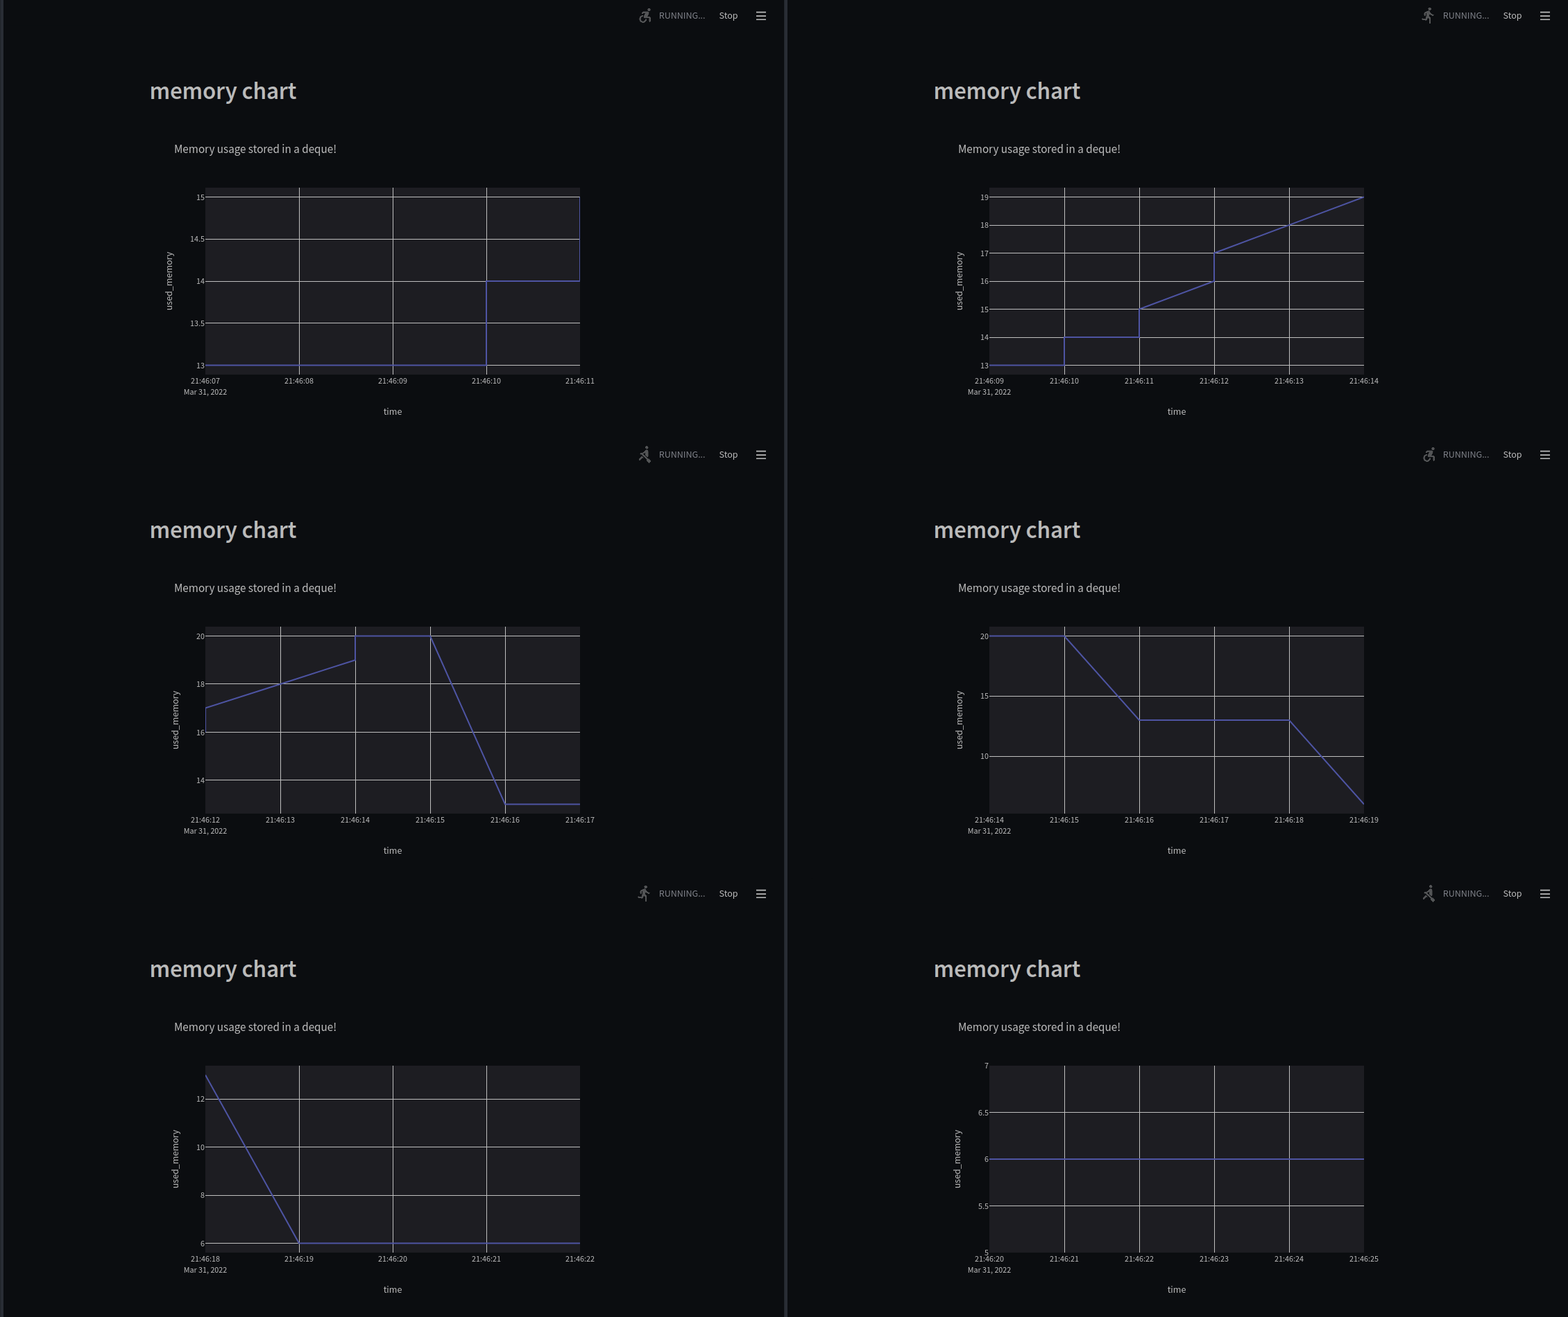
Now I'll prove just how easy it is to get a live data dashboard up and running with just a few lines of code thanks to streamlit!
if __name__ == "__main__": st.header("memory chart") stats = st.empty() while True: refresh_data() stats.plotly_chart( px.line( data, x="time", y="used_memory", title=f"Memory usage stored in a deque!", ) ) time.sleep(0.5)
st is the streamlit alias (imports shows at the bottom full example).
st.header puts a nice header on the page.
st.empty initializes an empty streamlit container in which we'll put a plotly.express figure.
At each iteration we'll refresh_data() which appends and pops data in the deques in the data dictionary.
Then we update the stats container with a plotly graph and the refresh happens seamlessly.
All in all the script looks like this:
from collections import defaultdict, deque import time from typing import Dict, MutableSequence, Optional from plotly import express as px import psutil import streamlit as st data: Dict[str, MutableSequence[Optional[float]]] = defaultdict(deque) arr_size = 10 data["time"] = deque([None] * arr_size) data["used_memory"] = deque([None] * arr_size) def refresh_data(): global data memory = psutil.virtual_memory() data["time"].append(time.strftime("%Y-%m-%d %H:%M:%S", time.localtime())) data["used_memory"].append(memory.used // (1024**3)) data["time"].popleft() data["used_memory"].popleft() def memory_chart(): fig = px.line( data, x="time", y="used_memory", title=f"Memory usage stored in a deque!", ) return fig if __name__ == "__main__": st.header("memory chart") stats = st.empty() while True: refresh_data() stats.plotly_chart(memory_chart()) time.sleep(0.5)
You can save this as my_dash.py and run with streamlit run my_dash.py and should see something like the following!

